Why is this needed?
When talking about performance testing, most folk think of stress and load testing, which involves measuring the response of your back-ends systems. Cause web sites were mostly static and almost all the processing was done on server side. But modern applications are using JavaScript frameworks like: React, AngularJS front-ends. These feature-rich front-ends add a new layer that needs to be measured.
A web application performance can be improved at two levels:
-
- Back-end/Server side
Typically, we believe that server-side bottlenecks are highly important because it can make the web application useless. - Front-end/Client side
Client-side performance issues are even more critical because they have more impact on user experience.
- Back-end/Server side
A study shows that: 80% of the end-user response time is spent on the front-ends, and only 20% on the back-end. So, the measurement of the front-end performance of an application becomes critical.
In this blog I will discuss techniques to measure the front-end performance.
What Can you Measured?
Different from back-ends performance testing which to measure from multi-users point of view where resources are used concurrently. Front-ends performance testing is about how fast does this page load from a single user point of view.
Before we dive into the technology, let’s look at the metrics that can measured the product front-ends performance.
- Page Load Time – Indicates when the page was completely loaded (or when the browser officially fired the on-load event).
- Speed Index – The visual completeness of the page as defined by Google.
- Time to First Byte – The amount of time it takes before the first byte of the response is received from the server, relevant application caches, or a local resource.
- Time to First Paint – This is the point at which pixels are first drawn on the scene. This metric excludes the default background paint but does include any user-defined background paint.
- Time to First Contentful Paint – The first contentful paint is triggered when any content (an object defined in the Document Object Model) is painted. This could be text, an image or canvas render.
- Time to First Meaningful Paint – The first meaningful paint is a browser-supplied metric that measures how long it takes for the most meaningful content to be fully rendered on the site. It is equivalent to the first contentful paint, and describes the duration until the browser first rendered any text, image (including background images), non-white canvas or SVG. This includes text with pending web fonts. This is the first moment when users could start consuming page content.
- Time to Interactive – The number of seconds from the time the navigation began until the layout is stabilized, web fonts are visible, and the page is responsive to user input. The page is stabilized if there was no task blocking for at least 50 ms.
- Time to First CPU Idle – How long it takes for the CPU to process all the page information.

Use Selenium
Like back-ends performance testing, we need to define the user behaviors through API calls. Then playback the APIs with large number of threads. For front-ends performance testing, we also need to playback the user behaviors, but this time is to simulate the operations in web browser.
Of course, Selenium! It’s the most appropriate solution. Selenium is the most widely used open-source tool for automating testing suite for web applications across a range of platforms and browsers.
Now initialize your Selenium project:
Choosing the feature or function you want to be measured and automate the user behaviors:
Now let measure the front-ends behaviors.
Add Browser Mob Proxy
BrowserMob proxy is a free tool that supports monitoring and manipulating the network traffic from web applications. The proxy is programmatically controlled via a REST interface or by being embedded directly inside Java-based programs.
It captures performance data in the HAR format.
Embedded BrowserMobProxyServer in Selenium project:
Setting new tracker before the feature you want to be measured:
Shutdown the BrowserMobProxyServer in tear-down step:
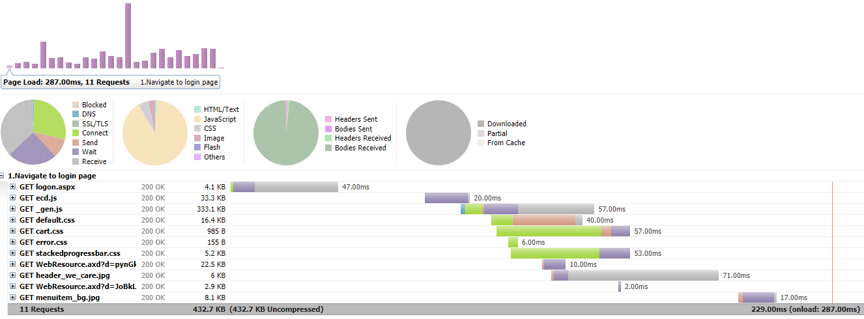
Report as HAR
The HAR format is based on JSON, as described in RFC 4627.
HAR is an open format for exporting HTTP tracing information called HTTP Archive (HAR). You can get:
- DNS information load time
- Each object requested (load time)
- Connection time to server
- From server to browser (load time)
- Object is blocked or not
Once executing the scripts, Chrome browse will be opened, all user behaviors will be simulated and HAR file will be generated.
You can check HAR file results using different tools:
- Browser Developer tools
- HAR viewer is a free and open-source application